My Biggest Investing Mistake? A World ETF Beat My Dividend Portfolio – Update 09/2026
An honest dividend portfolio update for September 2026: my €262,254 portfolio, why a world ETF (MSCI World) beat my dividend strategy over 5–10 years, and why the Vanguard FTSE Global All-Cap ETF is now my new core. All the numbers, the 7 sells, my 16 positions and the dividend forecast to 2027 – live from my Parqet dashboard.
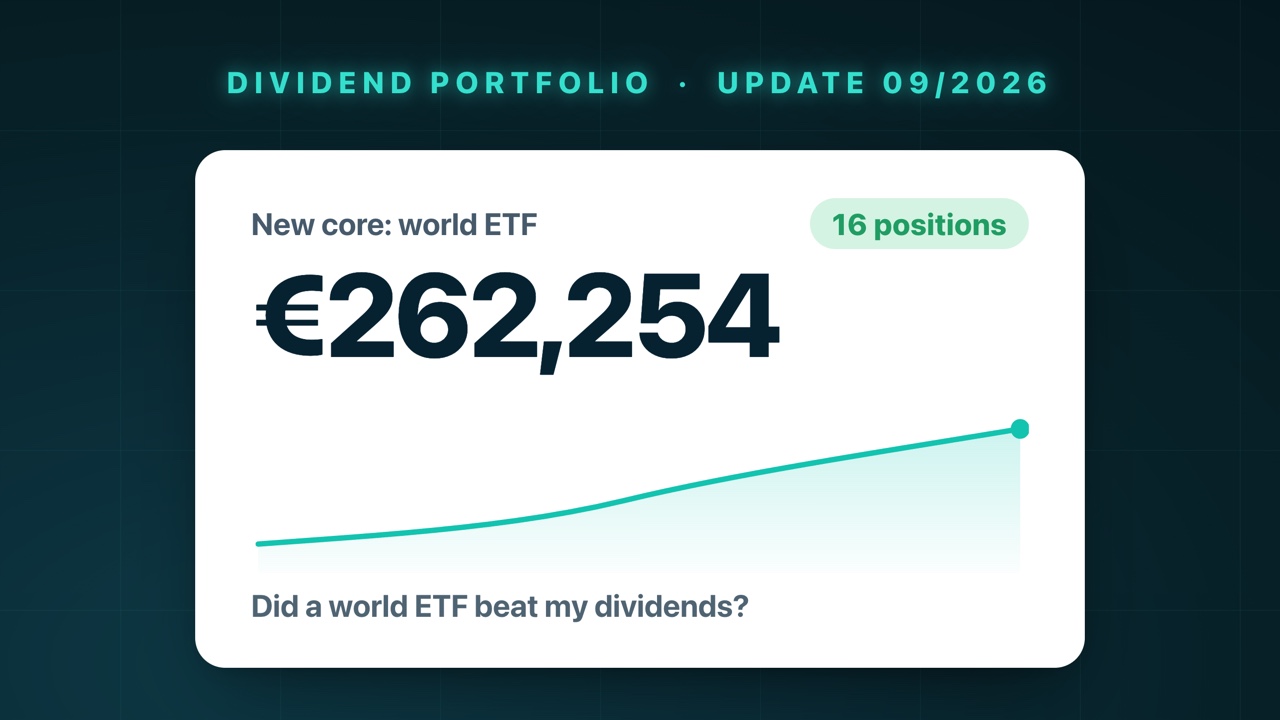
Table of contents
This update isn't an easy one for me, because I have to make something of a confession: a plain world ETF would have beaten my painstakingly hand-picked dividend portfolio over the last few years. So I'm drawing a conclusion – and I've added a broad world ETF to my portfolio as a new core. In this detailed dividend portfolio update (as of 14 September 2026) I'll transparently walk you through all the numbers, the new ETF, my 7 sells, my remaining 16 positions and the dividend forecast to 2027.
As always, the most important note first: this is not financial advice and not a buy recommendation. I only show my personal opinion and my personal investments. I'm responsible for my money, you for yours – always make your own decision.
The portfolio at a glance
For context: my dividend portfolio currently stands at €262,254.00. I've invested a total of €274,423.67, so I'm sitting on a paper loss of €12,169.67 (−4.43%). That sounds ugly at first, but it looks different once you see the other side: I've already collected €8,895.56 in dividends and locked in €26,092.15 in realised gains – a large chunk of that in the last few days from the reshuffle I'll get to shortly.
My portfolio's internal rate of return (IRR) is currently 7.70%. For context: on 27 August, a good two weeks before this recording, it was still at 10.94% – so the recent market dip has cost some return here. The portfolio is spread across 16 positions.
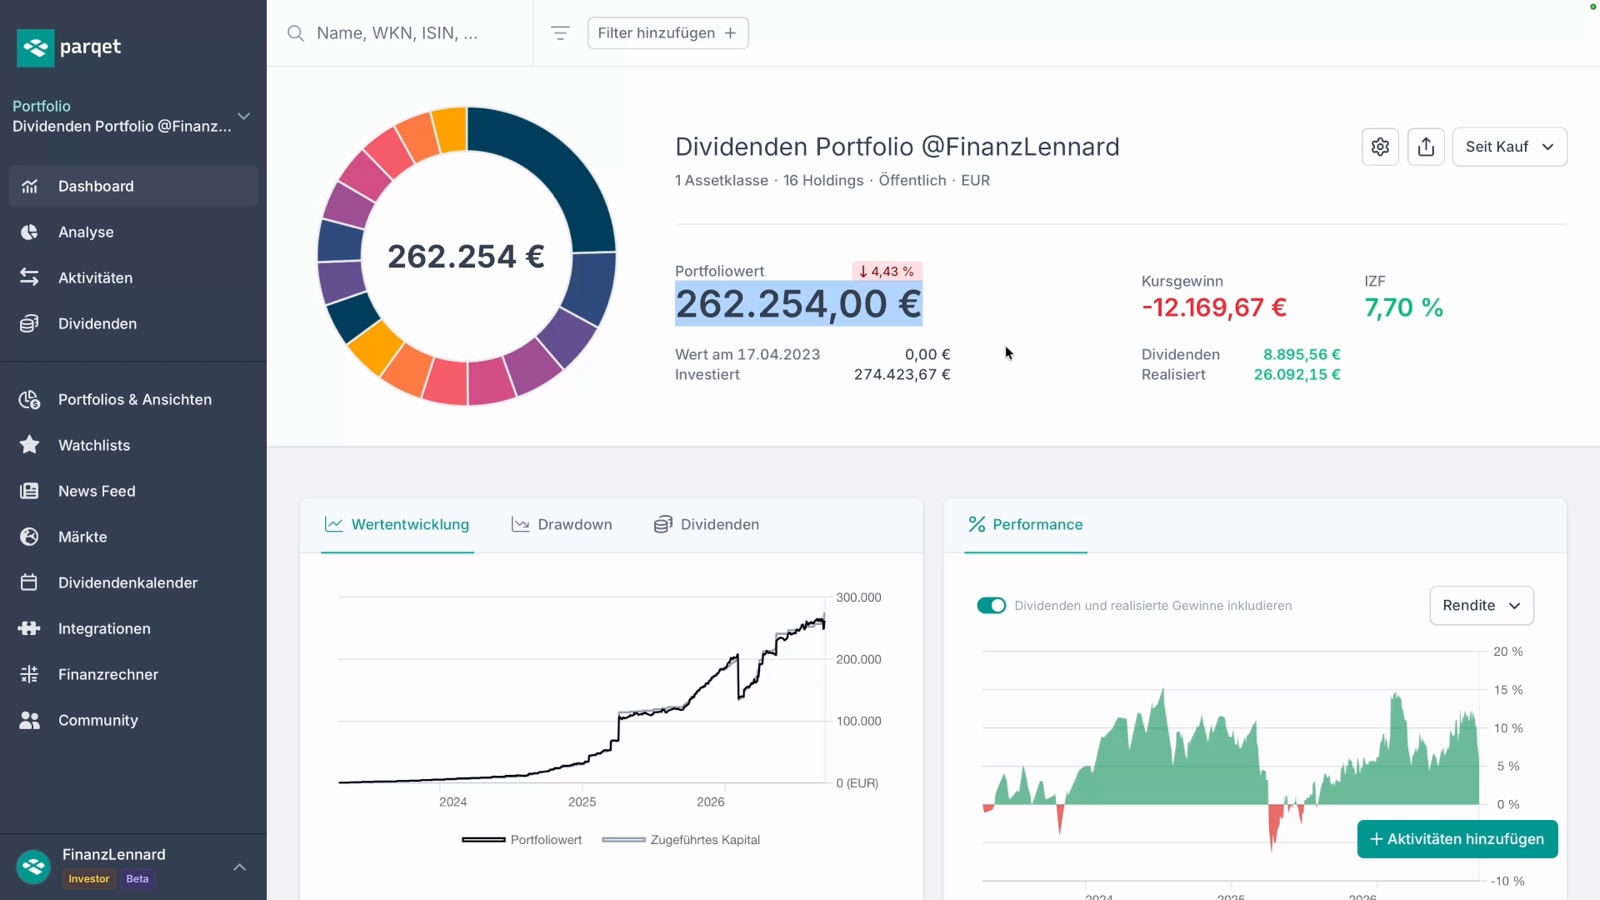
By the way, my entire portfolio is shared live via Parqet – so you can look at the composition, dividends and key figures yourself any time.
My confession: the world ETF beat me
Now for the real reason behind this update. I do stock-picking with dividend stocks out of passion – but I want to be honest with you (and with myself): over the last 5 and 10 years, a plain, broad world ETF would have performed better than my hand-picked strategy.
The numbers are clear. The MSCI World returned around 11.71% p.a. over 5 years and 13.56% p.a. over 10 years (USD, gross return, as of 31 Aug 2026). The even broader FTSE Global All Cap came in at 10.80% and 12.63% p.a. – about 0.9 percentage points per year less than the MSCI World, but still more than my stock selection has delivered net. In other words: both broad world indices would have beaten me.
For me that's no reason to throw dividend investing overboard entirely – I simply enjoy the predictable payouts and the psychological effect too much. But it's a clear nudge to give my portfolio a broad, cheap foundation that doesn't depend on my stock selection. And that's exactly what the new ETF is.
Video: My Biggest Investing Mistake? A World ETF Beat My Dividend Portfolio – Update 09/2026
The full update is also available as a video – I go through my Parqet dashboard, the new ETF and every reshuffle live. Feel free to watch, or read on below.
The new core: Vanguard FTSE Global All-Cap ETF
My new building block – and immediately the largest position – is the Vanguard FTSE Global All-Cap UCITS ETF (USD) Distributing. Here are the key facts:
- ISIN: IE000CVUM3N6 · Ticker: VGLD
- Launched: 18 August 2026 (first trading 20 Aug) – so the ETF is barely four weeks old
- Cost ratio (TER): 0.07% p.a. – extremely cheap
- Replication: physical via sampling (a representative selection of index constituents is bought, not necessarily every single one)
- Distribution: distributing, quarterly
- Index: FTSE Global All Cap – per justETF 10,017 holdings, i.e. maximum diversification including emerging markets and smaller companies
- Price: €4.29 per share

One point I put too briefly in the video and want to set straight here: I mention a fund size of "only €9 million". That's true – but only for the distributing share class on justETF. The entire fund is much larger at around $660 million per Vanguard, and the accumulating sister class (IE000VAHT5T0, ticker VGLA, also 0.07% TER) is already at around €556 million. So if you'd prefer it reinvesting, it's available as an accumulator too.
Regionally the USA dominates at 58.38%, followed by Japan (5.71%), the UK (3.30%), Taiwan (3.02%), Canada (2.91%) and China (2.49%). By sector, technology leads at 32.99% (about a third), ahead of financials (19.02%) and industrials (9.72%). The ten largest holdings together make up 21.18% – NVIDIA, Apple, Microsoft, Amazon, Alphabet (two share classes), Broadcom, TSMC, Meta and JPMorgan Chase.
On the dividend: as such a young product, the ETF hasn't reported its own distribution yield yet. The underlying index sits at around 1.6% per Vanguard's factsheet – so my estimate of "about 1.5%" is reasonable. I currently hold 15,000 shares at €4.29, which is around €64,350 and thus almost 24.5% of my entire portfolio.
What I sold for it: 7 positions
An ETF entry that size has to be funded, of course. To do it, I fully or partially sold seven positions in September – €69,526 in total:
| Sale | Shares | Price | Amount |
|---|---|---|---|
| Microsoft | 45 | €423.75 | €19,068.75 |
| Visa | 50 | €317.00 | €15,850.00 |
| SAP | 75 | €176.74 | €13,255.50 |
| Ferrari | 25 | €351.55 | €8,788.75 |
| Public Storage | 20 | €253.45 | €5,069.00 |
| Deutsche Post (DHL Group) | 70 | €54.72 | €3,830.40 |
| Chevron | 20 | €183.18 | €3,663.60 |
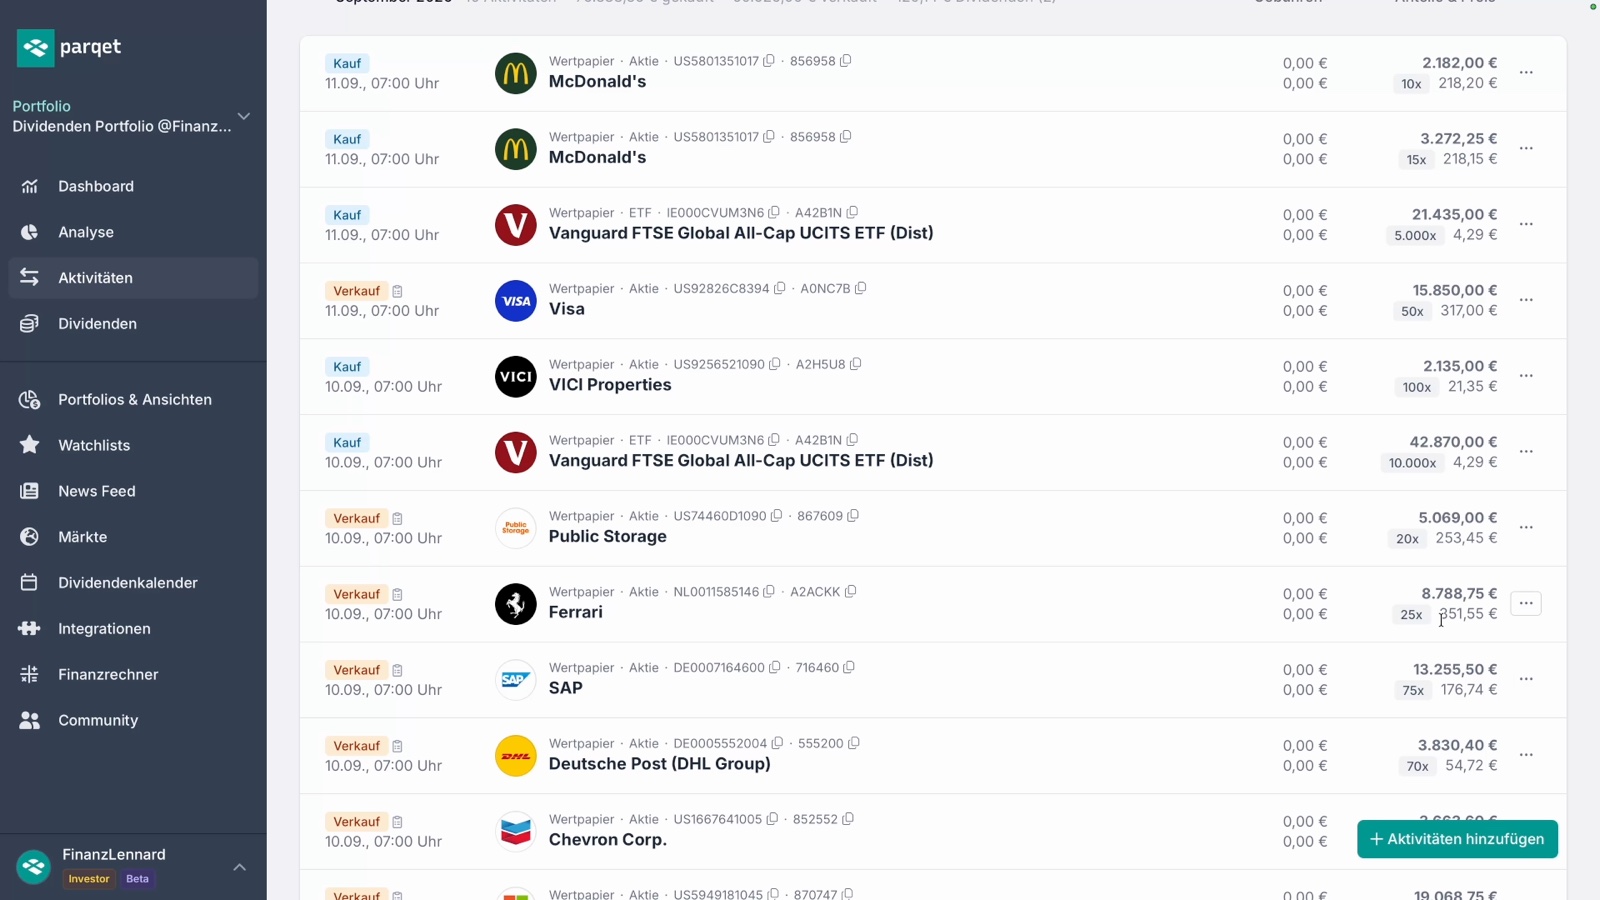
The biggest chunk was Microsoft – one of my winning positions, but not a classic dividend stock. With Chevron and DHL I closed rather small positions, likewise with Public Storage. The proceeds then flowed into the ETF in two tranches: first 10,000 shares (10 Sep), then another 5,000 shares (11 Sep). On the side, I topped up VICI Properties (100 shares) and McDonald's (in two tranches, now 100 shares).
My 16 positions at a glance
After the reshuffle, my portfolio looks like this – the world ETF at the top, then my dividend stocks, sorted by position value:
| # | Position | Value | Share |
|---|---|---|---|
| 1 | Vanguard FTSE Global All-Cap ETF | €64,350.00 | 24.5% |
| 2 | McDonald's | €22,005.00 | 8.39% |
| 3 | Munich Re | €15,261.00 | 5.82% |
| 4 | Procter & Gamble | €15,183.60 | 5.79% |
| 5 | Zoetis | €14,016.20 | 5.34% |
| 6 | Allianz | €13,324.50 | 5.08% |
| 7 | PepsiCo | €13,083.40 | 4.99% |
| 8 | Waste Management | €12,994.10 | 4.95% |
| 9 | Nestlé | €12,499.50 | 4.77% |
| 10 | Coca-Cola | €12,348.80 | 4.71% |
| 11 | LVMH | €12,342.00 | 4.71% |
| 12 | Realty Income | €11,433.40 | 4.36% |
| 13 | Hermès | €11,254.00 | 4.29% |
| 14 | Main Street Capital | €10,935.00 | 4.17% |
| 15 | VICI Properties | €10,900.00 | 4.16% |
| 16 | Novo Nordisk | €10,323.50 | 3.94% |
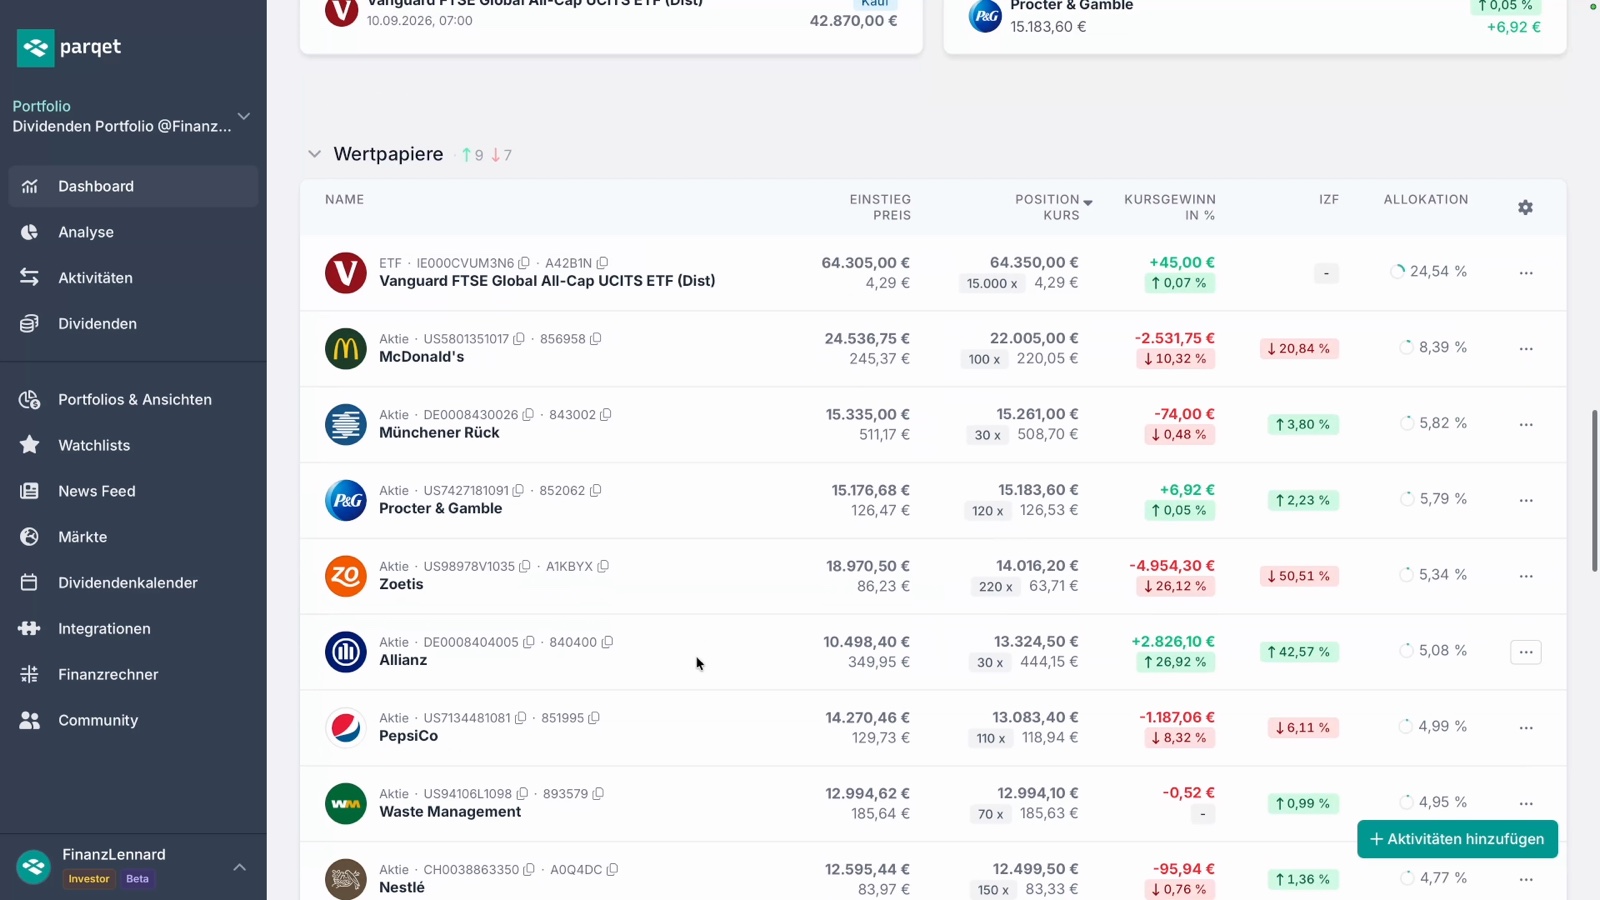
The largest individual stock remains McDonald's at 8.39%. On the winning side, Allianz (+42.57%) and Coca-Cola (+32.87%) are still ahead; my problem children remain Zoetis (−26.12%), Novo Nordisk (−24.47%) and LVMH (−20.88%). It's nice to see how the ETF now cushions the single-stock risks: even my largest stock position only weighs a good 8%, while the broadly diversified world ETF carries almost a quarter of the portfolio.
What this means for my dividends
A world ETF yielding around 1.5% obviously pays out less than some dividend stocks – yet I don't need to worry about my dividend goal. A look at the Parqet dividend calendar:
- 2026: around €6,790 in distributions
- 2027 (forecast): currently around €8,060 – plus an estimated €975 from the new world ETF (about 1.5% on around €65,000)
Together that gets me to a good €9,035 for 2027 – so I'd break the €9,000 mark for the first time. Important: the ETF only shows up in the calendar with a first small payment so far, because it's so young; the full quarterly distributions are still to come. And since I keep investing, the actual sum should end up higher. My long-term goal remains €10,000 to €12,000 in annual dividends – about €1,000 per month on average.
The tool I track everything with: Parqet
All the numbers in this update – portfolio value, IRR, dividends, forecast and the composition – come live from Parqet. I use it to track my entire portfolio and share it publicly, so you can view it any time. If you'd like to try Parqet Plus yourself: via my link* you get 15% off the first year as a new customer – the discount is applied automatically at checkout.
Conclusion
Admitting that a simple world ETF would have beaten the strategy you've painstakingly built isn't pleasant – but moments like these are exactly what move you forward as an investor. So I'm not turning my dividend portfolio into a pure ETF portfolio; instead I'm giving it a broad, cheap foundation with the Vanguard FTSE Global All-Cap and keeping my dividend stocks for the predictable cash flow. For me, that's the most honest and most relaxed combination.
How do you handle this – pure dividend portfolio, pure world ETF, or a mix like mine? Let me know in the comments, I reply to everyone. And if you want to follow my portfolio live: it's viewable any time via Parqet.
Links marked with * are affiliate links. If you start through them, you support my work – at no extra cost to you; on the contrary, you secure the discount. Thank you!
Frequently asked questions
Which world ETF did you buy?
The Vanguard FTSE Global All-Cap UCITS ETF (USD) Distributing – ISIN IE000CVUM3N6, ticker VGLD. It launched on 18 August 2026, costs 0.07% TER per year, tracks the FTSE Global All Cap index physically via sampling and distributes quarterly. There's also an accumulating version (IE000VAHT5T0, VGLA).
Did a world ETF really beat your dividend portfolio?
Over the last 5 and 10 years, yes: the MSCI World returned around 11.71% p.a. (5y) and 13.56% p.a. (10y), roughly 0.9 percentage points per year ahead of the FTSE Global All Cap (10.80% and 12.63%, USD, gross return, as of 31 Aug 2026). Both broad world indices beat the internal rate of return of my hand-picked dividend strategy. That was my wake-up call.
Are you now selling all your dividend stocks?
No. I sold 7 positions to fund the ETF (including Microsoft, Visa, SAP, Ferrari), but my portfolio is still mostly a dividend portfolio with 15 individual stocks. The world ETF was added as a broad, cheap core – not as a replacement.
How big is your dividend portfolio right now?
As of 14 Sep 2026 the portfolio value is €262,254, spread across 16 positions (15 individual stocks plus the new world ETF). I've invested €274,423.67, plus €8,895.56 in dividends received and €26,092.15 in realised gains.
How much dividend income do you generate?
In 2026 the forecast adds up to around €6,790. For 2027 the forecast currently shows about €8,060 – plus an estimated €975 from the new world ETF (roughly 1.5% on about €65,000), which would push me past the €9,000 mark. The long-term goal remains €10,000–12,000 per year.
What's the difference between the FTSE Global All Cap and the MSCI World?
The MSCI World holds around 1,400 large and mid-cap companies from developed markets. The FTSE Global All Cap is broader: over 10,000 holdings including emerging markets and small caps. Historically the MSCI World has run slightly better recently, while the All Cap is more diversified. I deliberately chose maximum diversification.
Disclaimer
⚠️ Not investment advice
All content is for information and entertainment purposes only and does not constitute investment advice, a buy recommendation or an invitation to enter into a financial product. Please do your own research and make decisions based on your personal situation and risk tolerance.
📉 Risk warning & total loss
Investments in securities and other financial instruments generally carry significant risks (e.g. price, market, currency, volatility and credit risks). A total loss of the capital invested cannot be ruled out.
📊 Returns & forecasts
All performance figures, whether historical or as a forecast/estimate, are not a reliable indicator of future results. Capital and returns are not guaranteed.
🔍 Transparency & conflicts of interest
I strictly distinguish between facts and personal estimates. Important: I am often invested in the assets discussed myself, which can create a conflict of interest.
✅ DYOR (Do Your Own Research)
All information has been compiled carefully but is non-binding, without warranty and without any claim to completeness. Please inform yourself thoroughly and consider all opportunities and risks in depth before making an investment decision.
Advertising & affiliate notice
Links marked with * are advertising or affiliate links. If you sign up or buy something through such a link, I may receive a commission – at no extra cost to you. This supports my work.