Parqet Review 2026: My Test of the Portfolio Tracker
I use Parqet to track all my portfolios in one place. In this review I show you all the features, prices, pros and cons – and what to look out for in a portfolio tracker.
Table of contents
- What is Parqet?
- What I use Parqet for
- Setup: a first dashboard in 5 minutes
- The dashboard: all metrics at a glance
- Analysis & X-Ray: spot cluster risks
- Dividend dashboard: my favourite feature
- App & integrations
- Prices: what does Parqet cost?
- My points of criticism: what to look out for
- Pros and cons at a glance
- Is Parqet worth it?
- Conclusion: my Parqet experience
- FAQ
How much is my wealth really worth right now – across all portfolios? No single broker can answer this simple question. That's exactly what I use Parqet* for: the portfolio tracker brings all my portfolios together in one place and shows me real returns, dividends and cluster risks at a glance. In this review I go through all the features, prices, pros and cons – and tell you honestly what to look out for. (As of August 2026)
As always up front: this is not investment advice, but my personal review. And for transparency: the links in this article are partner links – through them, with the code FINANZLENNARD, you even get 15% off Parqet Plus.
What is Parqet?
Parqet is a portfolio tracker from Germany: you import your portfolios, and Parqet visualises your complete wealth development – price gains, dividends, fees, taxes and real return metrics like IRR (internal rate of return) and TTWROR (time-weighted return). Important to understand: Parqet is not a broker. You still buy and sell at your account provider; Parqet has no access to your money.
A few facts about the company:
- Parqet Fintech GmbH from Hamburg, founded by Sumit Kumar – started as an after-work project under the name "Tresor One", renamed Parqet in 2021
- Over 350,000 users, the app has 4.7 stars in the App Store
- Data is stored in Germany, anonymised and kept separate – Parqet stresses that it doesn't make money with personal data
- Built profitably and completely without investors – the whole thing is paid for via the subscriptions, not via your data
What I use Parqet for
My investments are deliberately not with a single provider: several portfolios, plus cash accounts. You might know the problem – each broker only shows its own slice, and the "return" in the broker dashboard likes to ignore dividends, fees or deposits and withdrawals.
In Parqet* all my portfolios come together. Concretely I use it for three things:
- Total wealth in view: one dashboard instead of five apps – including the question of how my wealth has developed since the first purchase. You regularly see the numbers from it in my net worth updates
- Real return instead of gut feeling: IRR and TTWROR show me what really remains after fees and taking all cash flows into account
- Dividend planning: which payouts are coming this month, how my monthly dividend income develops over the years
Setup: a first dashboard in 5 minutes
Setup is the point where Parqet beats most competitors. Three ways lead to the portfolio:
1. PDF import (my favourite): you simply drag your broker's statement PDFs into the browser. Parqet automatically recognises purchases, sales, dividends and fees – over 50 brokers are supported, from Trade Republic through ING and DKB to the Sparkassen. Parqet aptly calls this "zero-click import".
2. Autosync: with some banks (e.g. ING or Consorsbank) you connect your account once, after which new transactions land in your portfolio automatically – the connection works so that Parqet never sees your bank login details.
3. Manually or via CSV: you add legacy holdings, portfolio transfers or exotic assets by hand or import them as CSV – also from other tools.
My tip for getting started: create a separate portfolio in Parqet for each real account (possible from Plus) – then you can analyse each portfolio individually as well as everything combined.
The dashboard: all metrics at a glance
The centrepiece is the portfolio dashboard: portfolio value, invested capital, price gains, dividends received, realised gains and the performance as a chart – optionally also as a performance or drawdown view.
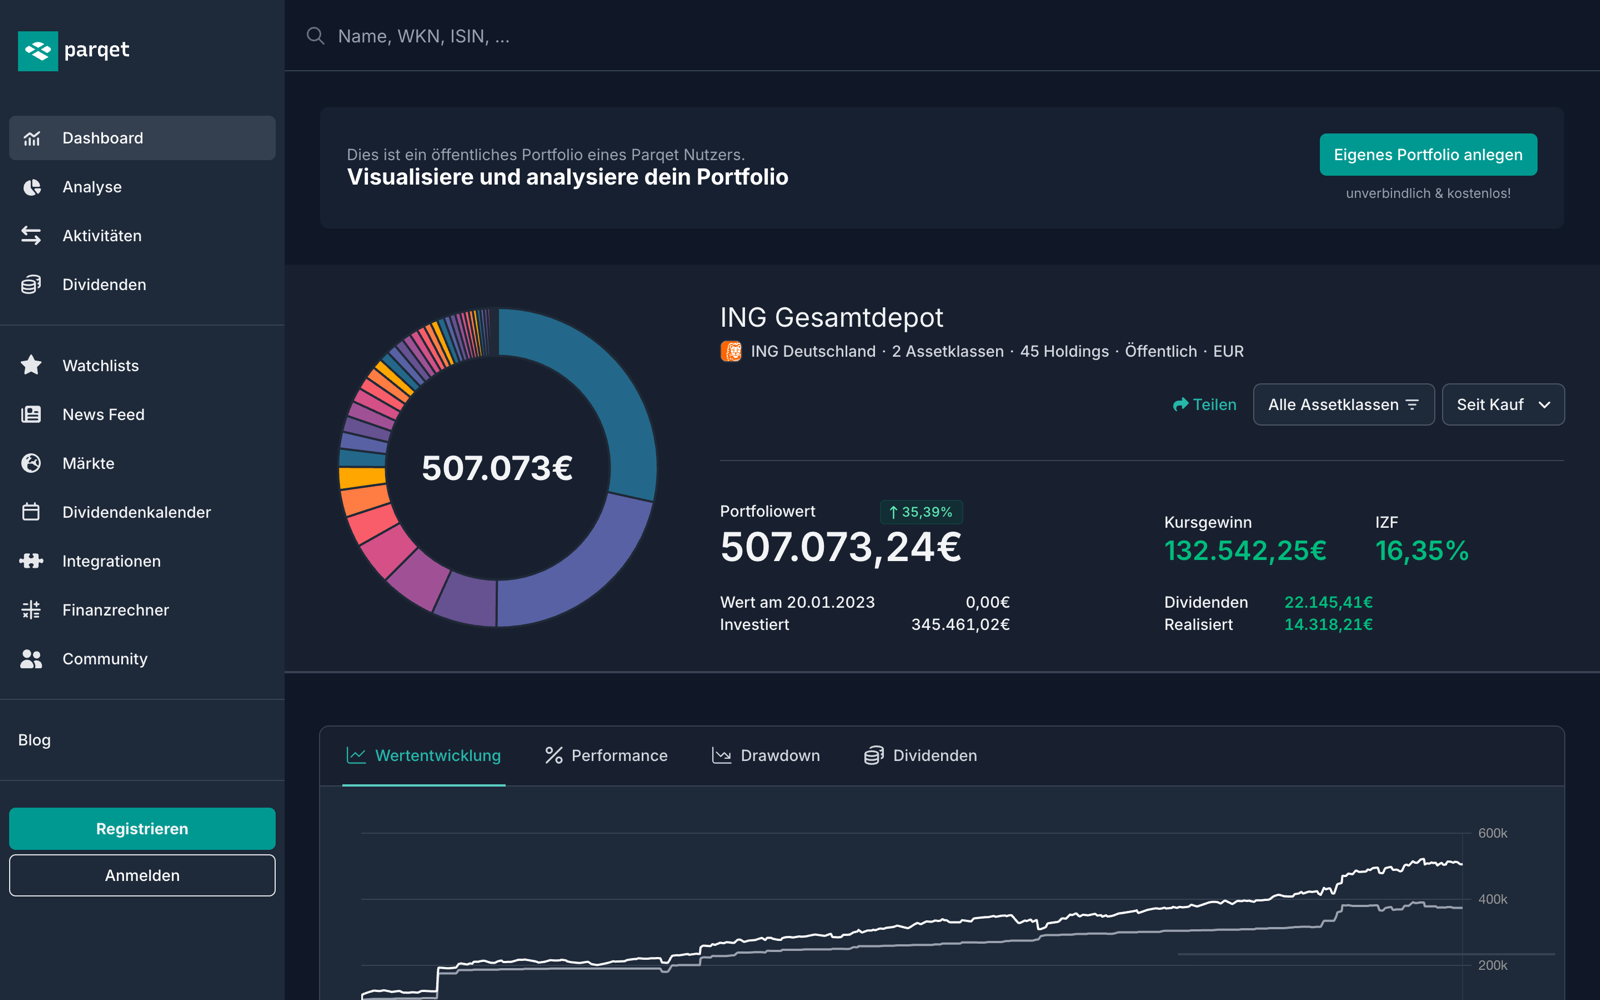
What I particularly like here: Parqet calculates honestly. The return section shows taxes and fees separately and displays the net profit alongside the gross one. Anyone who has only looked at their broker's polished "performance" display for years sometimes gets a little surprise here.
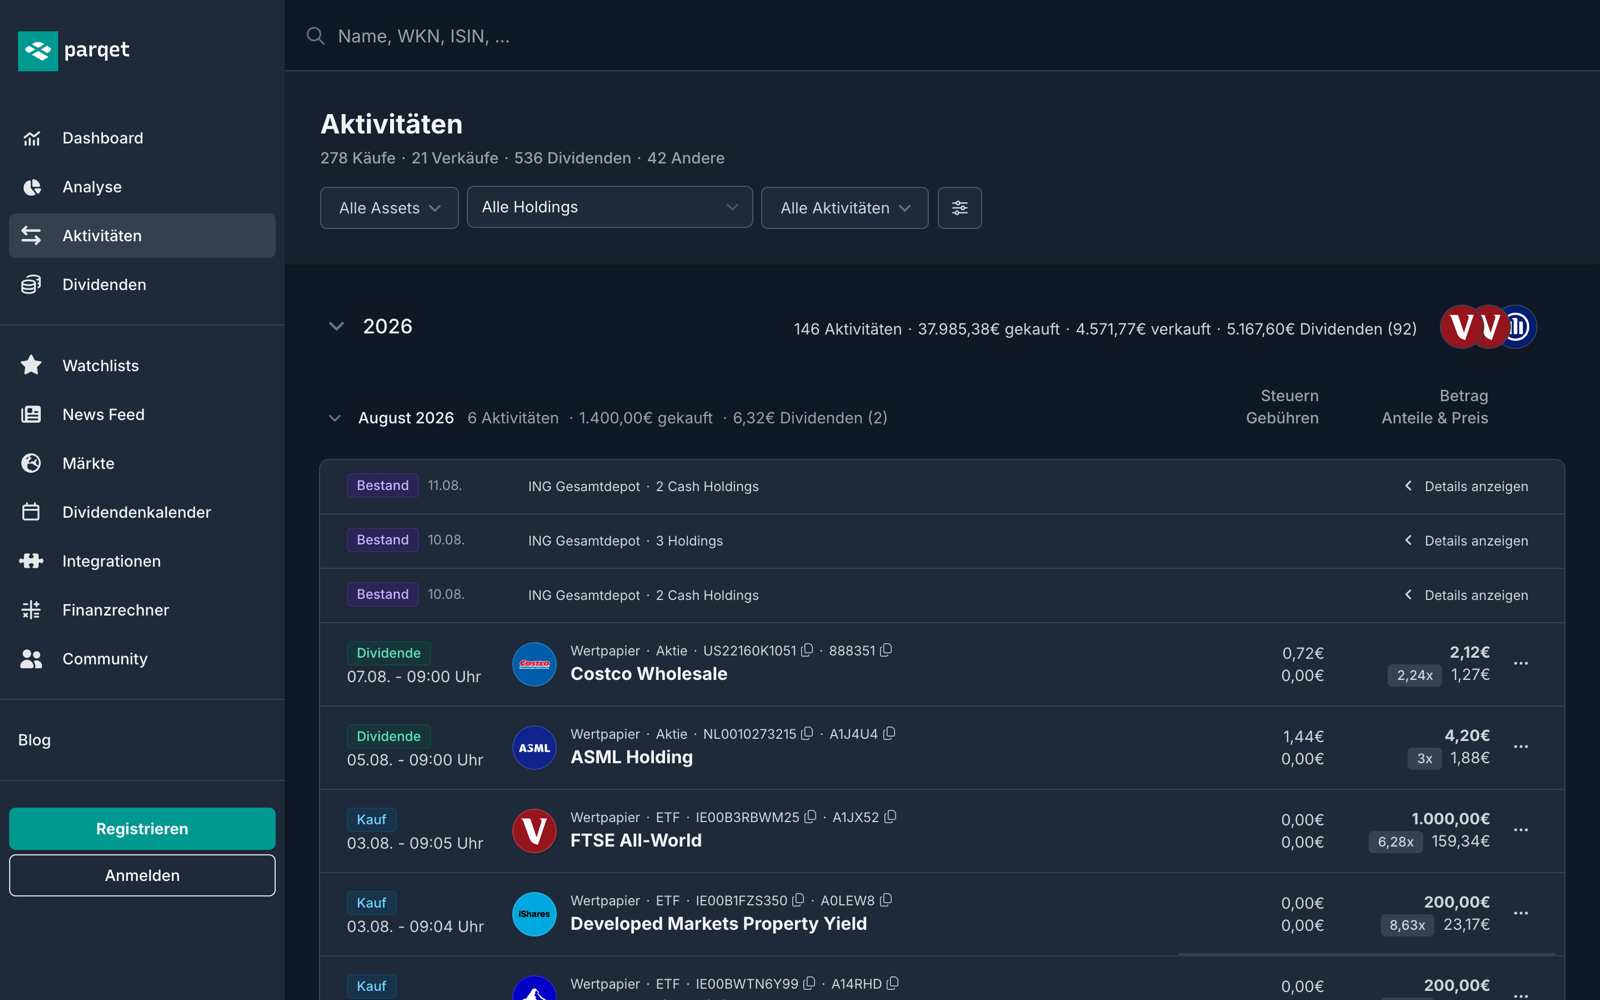
Under "Activities" you'll find every single transaction chronologically – filterable by assets, holdings and activity type. Especially with several portfolios this is gold when you want to trace when which dividend flowed.
Analysis & X-Ray: spot cluster risks
The portfolio analysis breaks your wealth down by asset class, sector, region, country, currency and company size. That sounds standard at first – but the clou is Parqet X-Ray (from Plus): the feature looks inside your ETFs and converts their composition to your total portfolio.
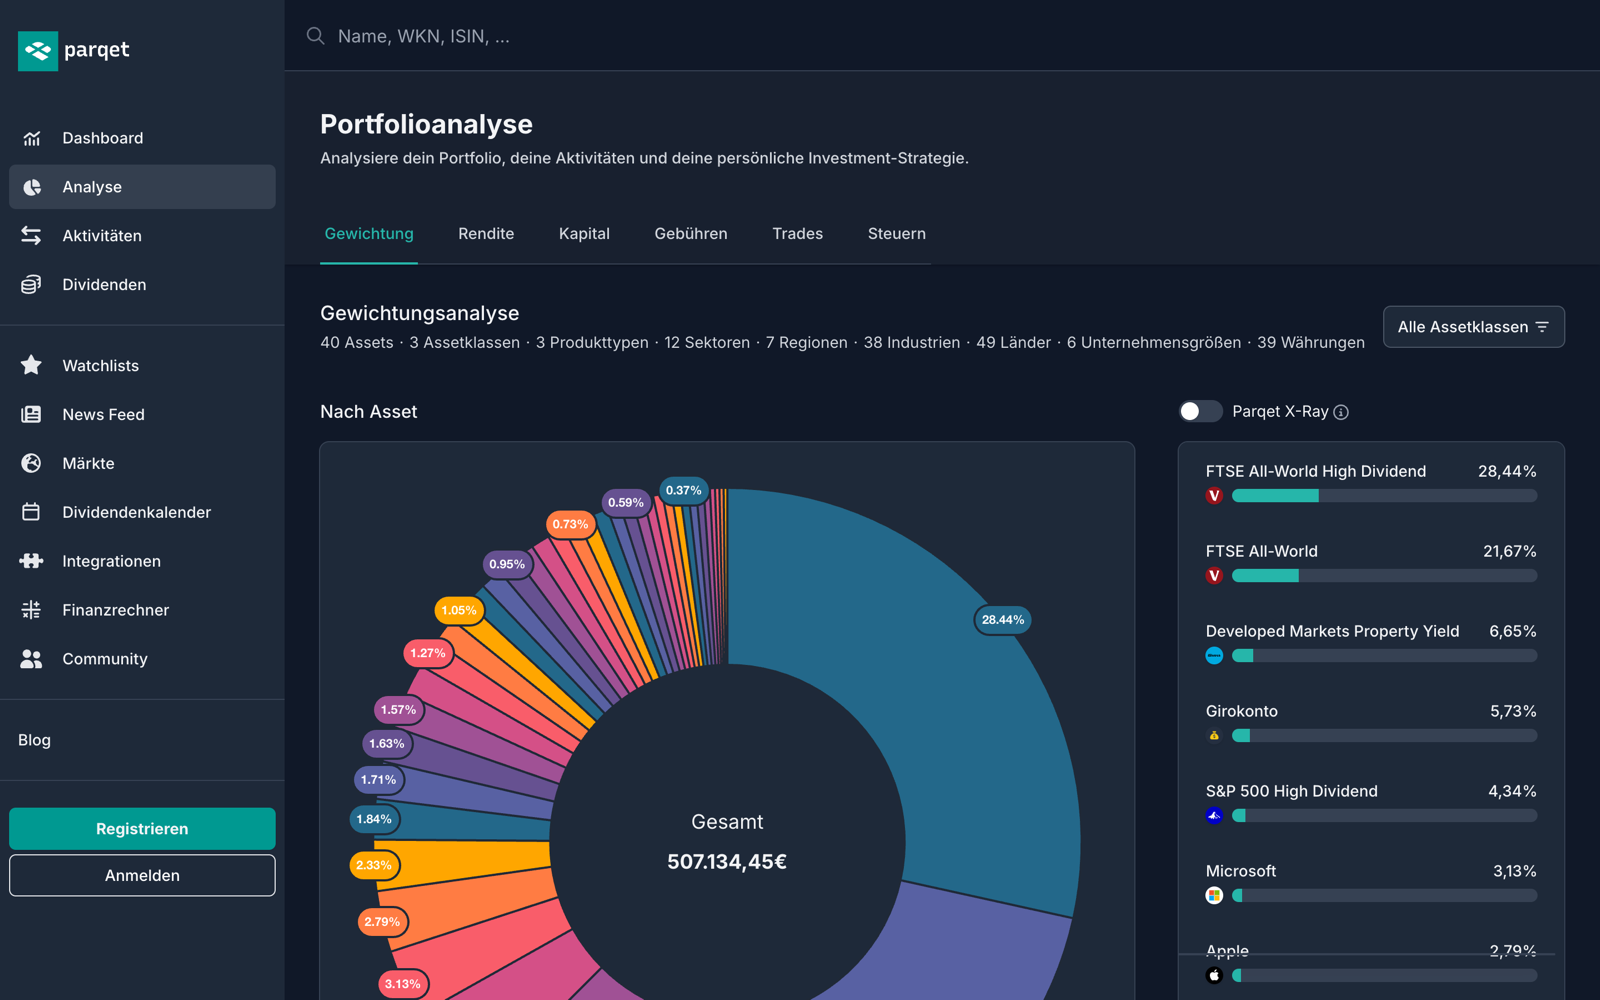
Why this matters: anyone holding an MSCI World, an S&P 500, plus Apple and Microsoft shares effectively has the US tech giants three or four times over in the portfolio. Without X-Ray you don't see that – with X-Ray you spot such overlaps at a glance and can counteract. For me one of the strongest arguments for Parqet Plus*.
On top of that come analyses of return, capital invested, fees, trades and taxes – each as its own tab in the analysis.
Dividend dashboard: my favourite feature
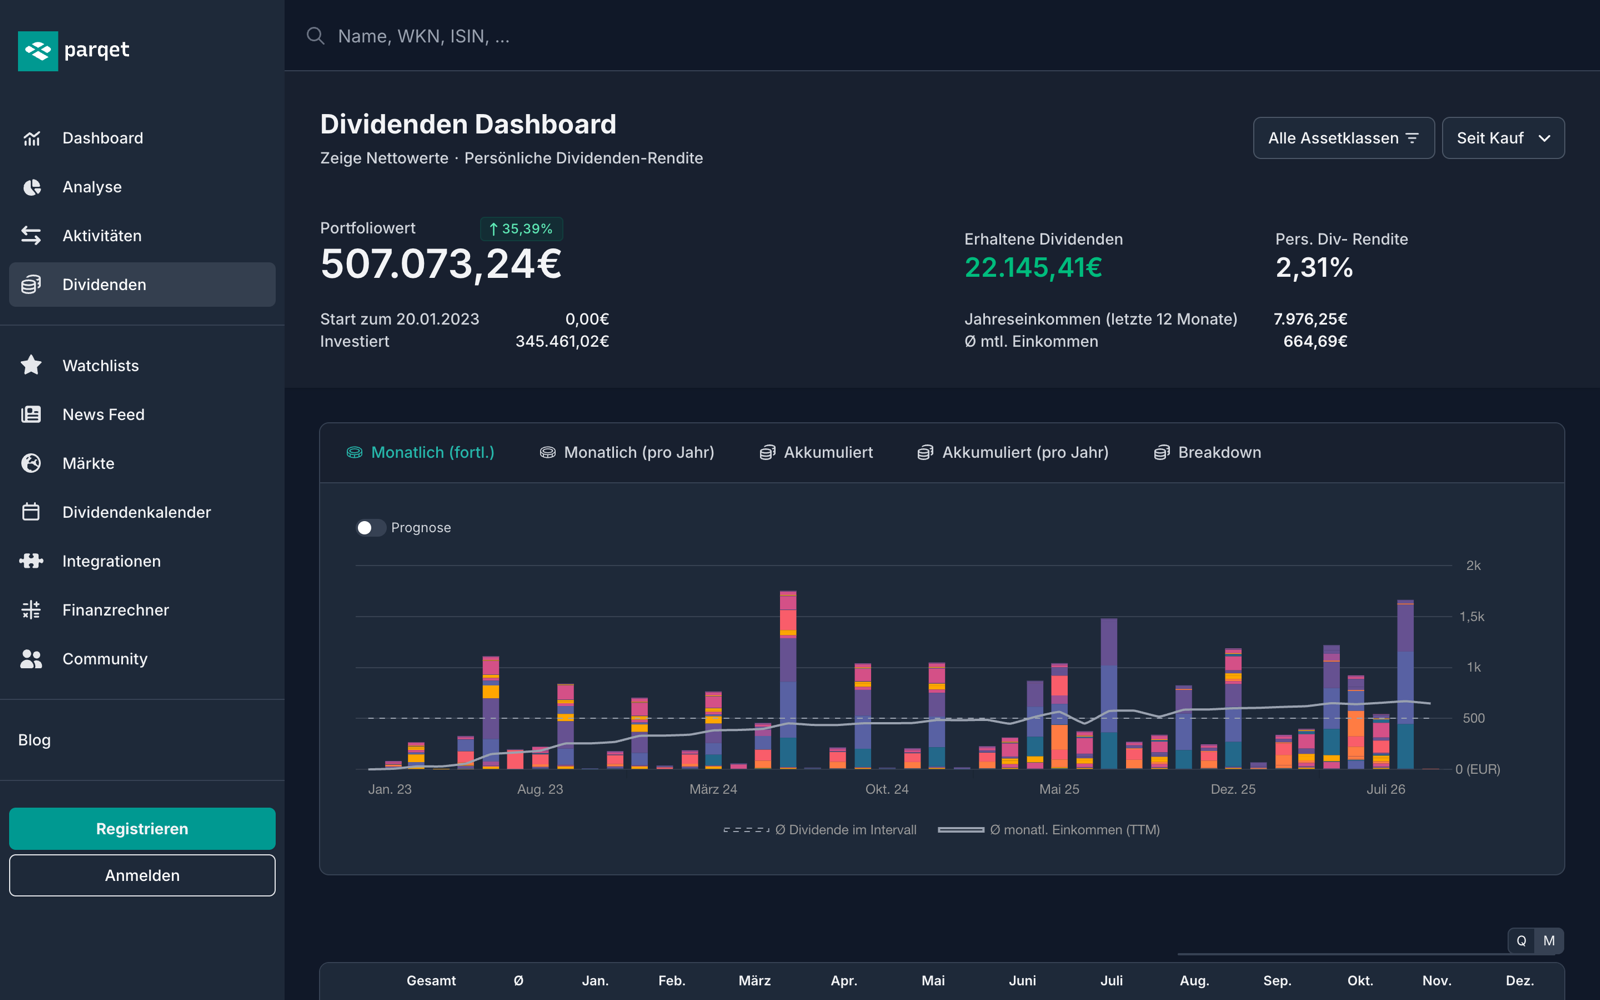
As a dividend fan, this is the area where Parqet really shines for me. The dividend dashboard shows you:
- Dividends received in total and per month – as a bar chart over the years, including your personal dividend yield
- Forecast (from Plus): what's expected to arrive in the next 12 months, based on announced payouts
- Avg. monthly income: the most motivating figure of all for me – seeing this line rise over the years makes the strategy tangible
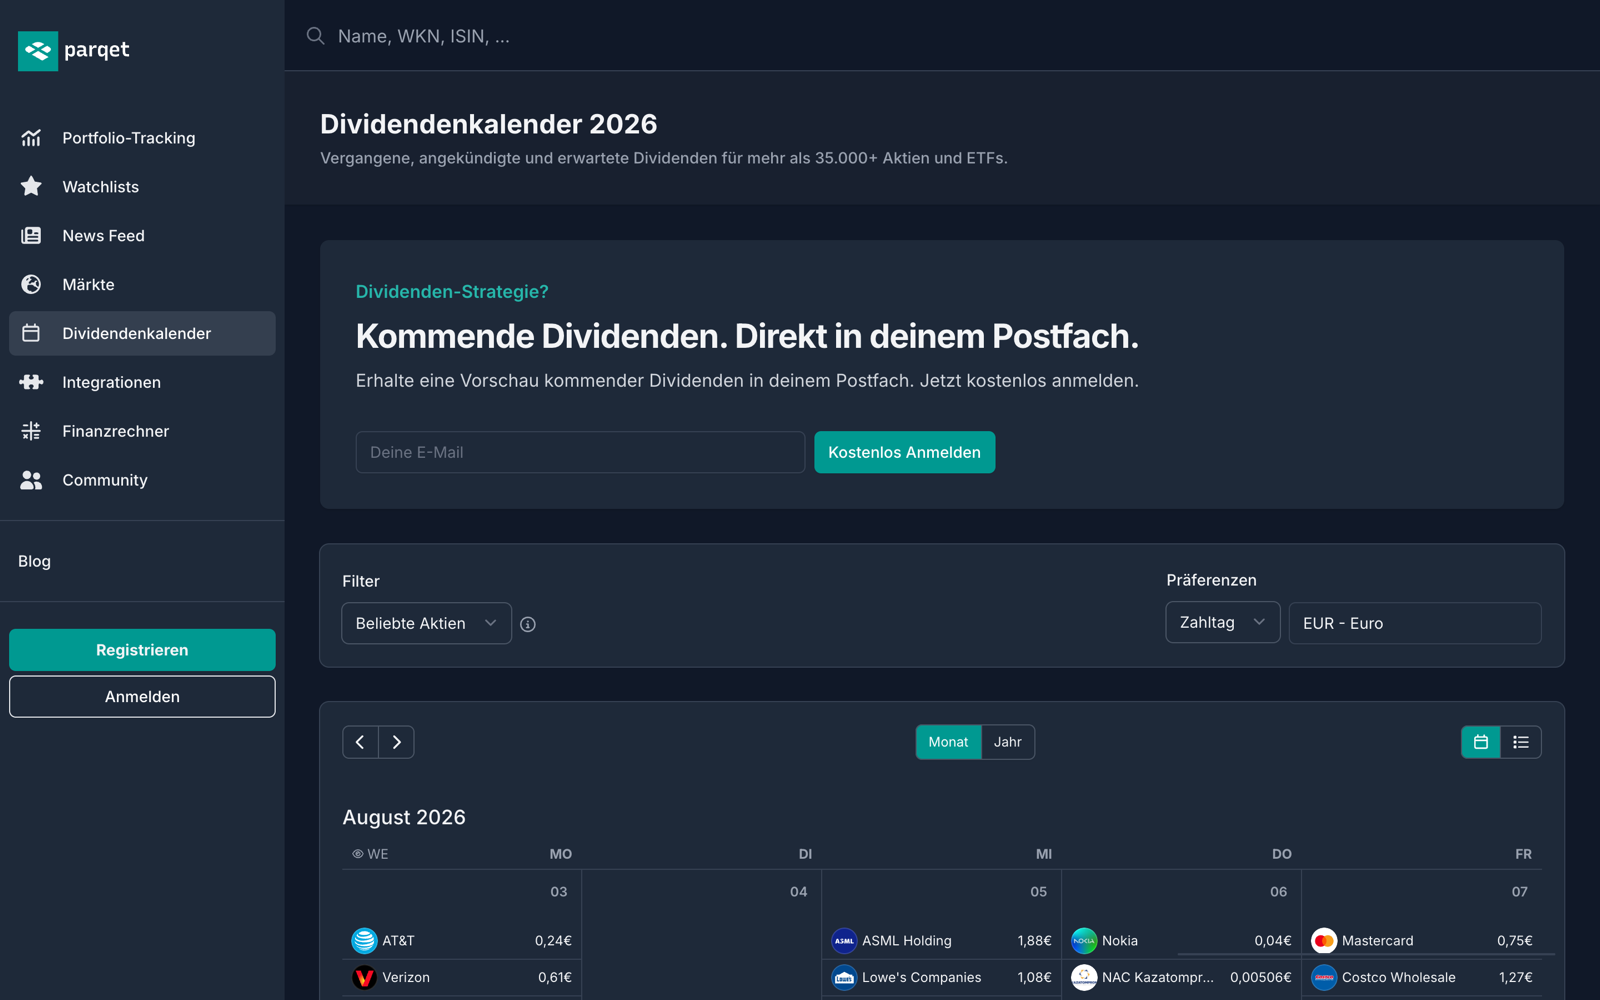
On top of that there's a global dividend calendar with data on more than 35,000 stocks and ETFs – including ex-date, payment date and filter options. You can even use it for free without an account.
App & integrations
Parqet runs in the browser as well as a native app for iOS and Android – with 4.7 stars in the App Store. The dashboard looks just as tidy on the phone as on the desktop, and for the daily look at my portfolio I now use almost only the app.
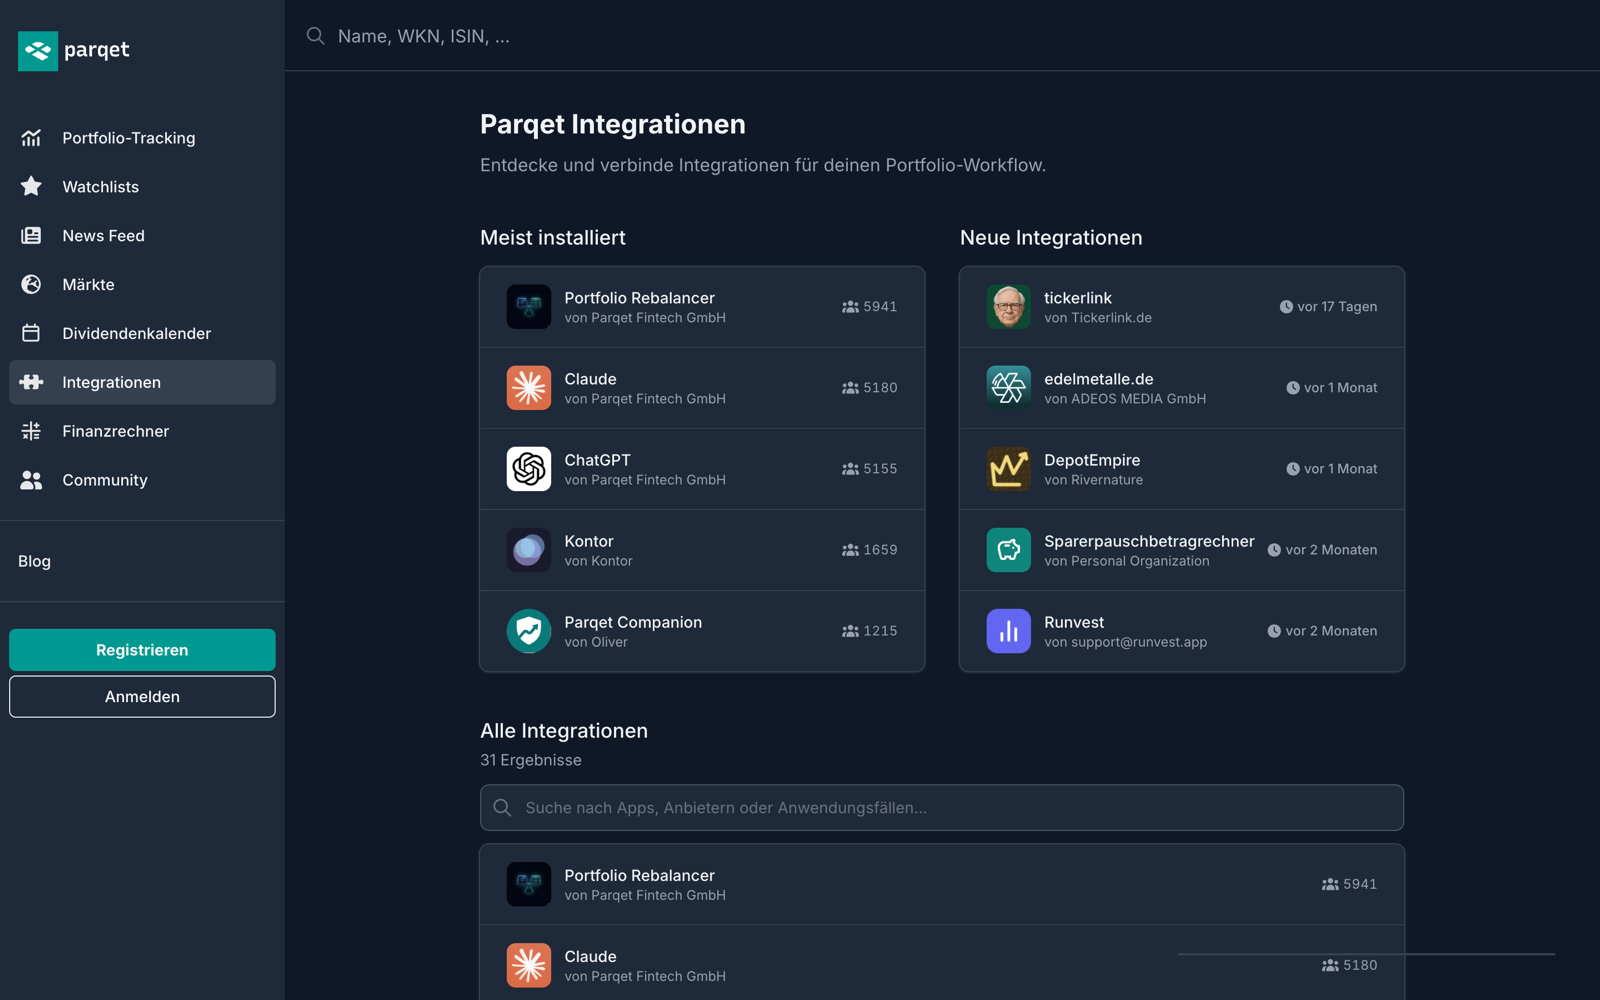
I find the integrations platform exciting: besides practical tools like a portfolio rebalancer, you can now even connect your portfolio with Claude and ChatGPT and have your real portfolio data analysed by AI – for example "Where is my portfolio too concentrated?". A Bitpanda connection has been announced.
Prices: what does Parqet cost?
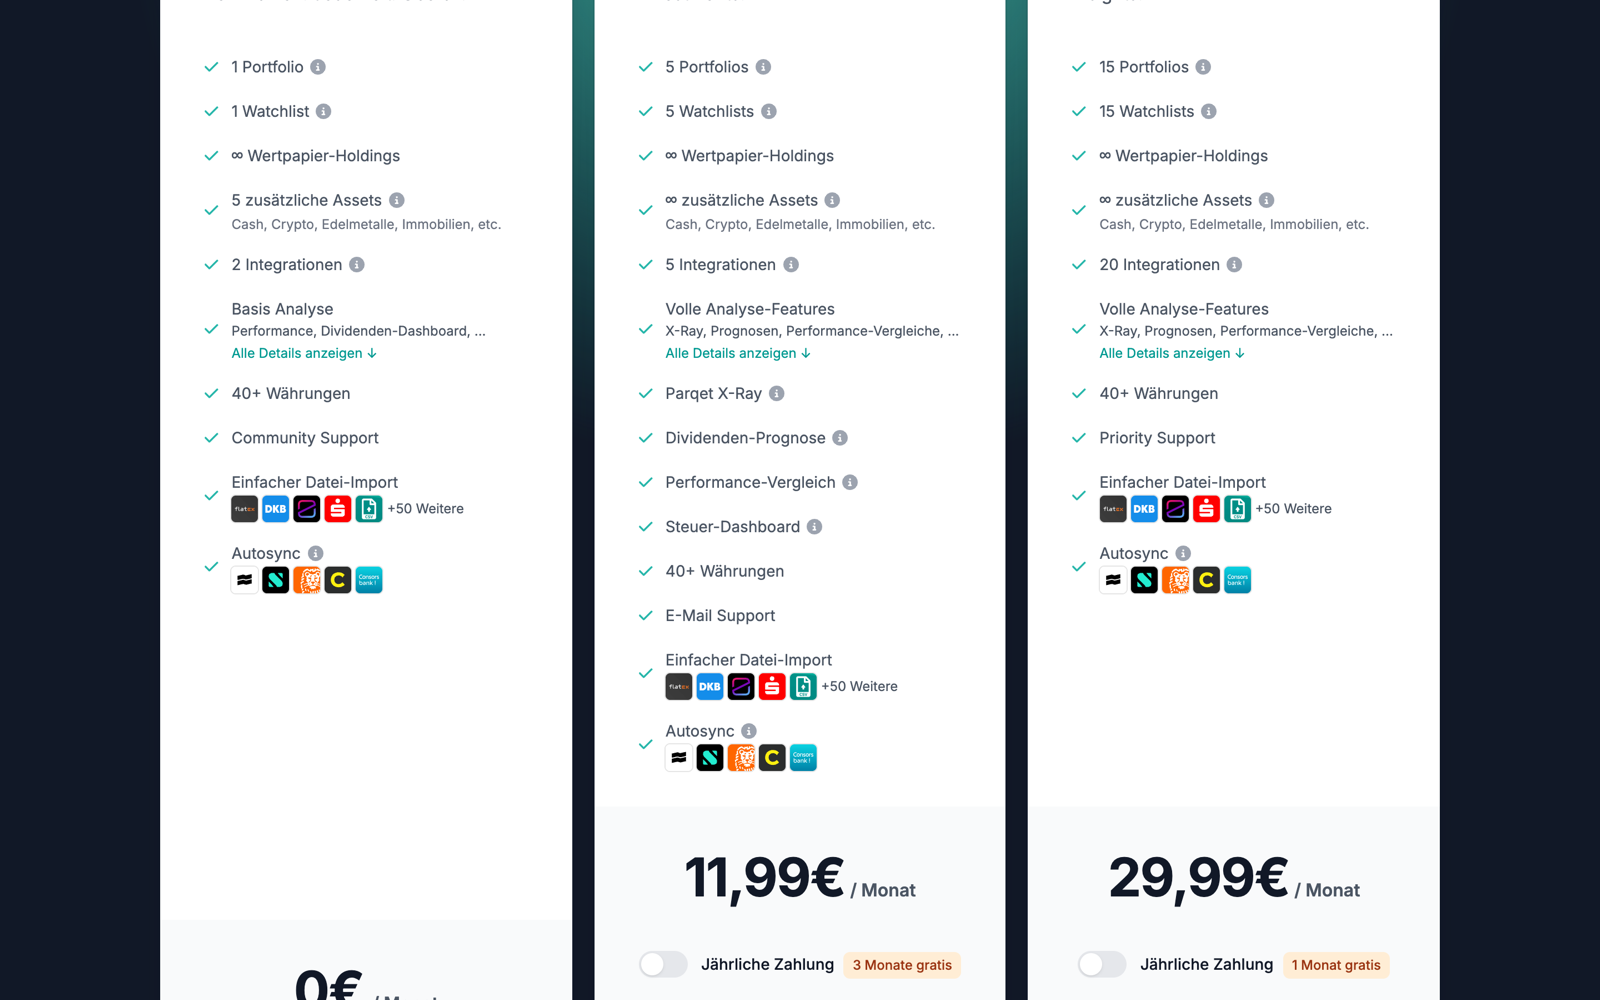
Parqet comes in three tiers:
- Basic (€0): 1 portfolio, 1 watchlist, unlimited securities holdings, 5 additional assets, 2 integrations, basic analysis – permanently free
- Plus (€11.99/month or €99.99/year): 5 portfolios, 5 watchlists, unlimited additional assets (cash, crypto, precious metals, real estate), all analysis features including X-Ray, dividend forecast, performance comparison and tax dashboard
- Investor (€29.99/month or €329.99/year): like Plus, but with 15 portfolios, 15 watchlists, 20 integrations and priority support
You can test all paid plans free for 14 days. And here's where my discount comes in: with the code FINANZLENNARD you get 15% off the first year of Parqet Plus as a new customer – instead of €99.99 you pay €84.99, so around €7 a month. Via my link* the discount is activated automatically at checkout. You'll find all the details in my Parqet discount code article.
My points of criticism: what to look out for
As much as I enjoy using Parqet – a few things you should know before subscribing:
- The best features are in the subscription. X-Ray, dividend forecast, tax dashboard and multiple portfolios are only available from Plus. The free version is enough for tracking one portfolio, but the real analysis power costs money
- Paying monthly isn't worth it. €11.99/month is almost €144 a year – the annual subscription costs €99.99. If Plus, then annually (and with a discount code)
- Autosync is only available for a few banks. With most brokers it means: regularly pull in PDF statements. For me that takes only a few minutes per month, but it's just not "fully automatic"
- The tax dashboard doesn't replace a tax return. The analyses are great for orientation (e.g. how much of the allowance is already used), but it's not an official report for the tax office
- Not made for pro risk analysis. Anyone needing institutional metrics like the Sharpe ratio or beta hits limits – Parqet is clearly aimed at private investors
- Consider it for very small portfolios. Whether ~€85–100 a year is worth it depends on the portfolio value. For a €2,000 portfolio with one savings plan, the basic version will do
Pros and cons at a glance
In favour of Parqet:
- All portfolios in one place – with honest returns (IRR, TTWROR) instead of polished broker performance
- Effortless import: PDF via drag & drop, over 50 brokers, some autosync
- Strong dividend dashboard with calendar and forecast
- X-Ray reveals ETF overlaps and cluster risks
- Cash, crypto, precious metals and real estate can also be mapped
- Web + native apps (4.7 stars), modern integrations (Claude, ChatGPT, rebalancer)
- Data in Germany, transparent business model without selling data
- Free basic version and 14-day trial
Against it:
- Analysis features like X-Ray and forecasts only in the paid subscription
- Monthly price of €11.99 comparatively high – much fairer annually
- Autosync only available for a few banks
- No official tax report, no advanced risk metrics
- For mini portfolios the subscription is oversized
Who is Parqet worth it for?
- have several portfolios at different brokers and want to see your real overall return
- follow a dividend strategy and want to plan payouts including a forecast
- want to X-ray your ETF overlaps and cluster risks
- are looking for a convenient tool with an app instead of maintaining Excel sheets
- only fund a single savings plan and your broker dashboard is enough for you
- want a completely free tool and don't mind learning Portfolio Performance for it
- expect official tax reports for the tax office – Parqet doesn't provide that
Conclusion: my Parqet experience
Parqet is the tool that finally turns "many portfolios" into "one fortune" for me. Setup is done in minutes, the dashboards are the tidiest I've seen in a portfolio tracker, and features like X-Ray and the dividend forecast deliver real added value instead of gimmicks. The fact that the data is in Germany and the business model is based on subscriptions instead of selling data rounds off the picture.
The weaknesses are manageable once you know them: the full power is only available in the subscription, autosync remains the exception, and for the tax office you still have to calculate yourself. My advice: start with the free basic version or the 14-day trial and see whether the analysis features grab you. If so, get Parqet Plus* on the annual subscription – with the code FINANZLENNARD you pay only €84.99 instead of €99.99 in the first year.
Frequently asked questions
Is Parqet free?
Yes, Parqet's basic plan is permanently free and includes one portfolio, one watchlist, unlimited securities holdings and the basic analysis. You can test the paid plans Plus (from €99.99/year) and Investor (from €329.99/year) free for 14 days.
Is Parqet trustworthy and secure?
Yes. Behind Parqet is Parqet Fintech GmbH from Hamburg with over 350,000 users. Data is stored in Germany, anonymised and kept separate. Parqet stresses that it doesn't make money with personal data – the business model is the subscriptions.
Which brokers does Parqet support?
Over 50 brokers are supported for PDF and file import, including Trade Republic, Scalable Capital, ING, DKB, flatex, comdirect and the Sparkassen. With some banks like ING or Consorsbank there's also autosync, where new transactions land in your portfolio automatically.
Can I buy or sell stocks via Parqet?
No. Parqet is a pure tracking and analysis tool and not a broker. You still trade via your own account – Parqet only visualises your data and has no access whatsoever to your money or your securities.
What sets Parqet apart from Portfolio Performance?
Portfolio Performance is a free but much more technical desktop software with a steep learning curve. Parqet focuses on convenience: cloud-based, mobile apps, automatic PDF import and ready-made dashboards. Anyone who wants maximum control for free takes Portfolio Performance – anyone who wants convenience takes Parqet.
Does Parqet calculate my taxes?
Parqet Plus includes a tax dashboard that clearly summarises realised gains, taxes paid and your allowance. But it's only for orientation – it's not an official tax report for the tax office or a replacement for the tax return.
Is there a Parqet discount code?
Yes. With my code FINANZLENNARD you get 15% off the first year of Parqet Plus – instead of €99.99 you pay €84.99. Via my link finlen.de/parqet the discount is activated automatically at checkout.
Is Parqet Plus worth it?
For investors with several portfolios, a dividend strategy or ETF-heavy portfolios, Plus is clearly worth it: X-Ray, dividend forecast, tax dashboard and multiple portfolios are only available there. Anyone who only wants to track one portfolio with basic functions gets by with the free basic plan.
Disclaimer
⚠️ Not investment advice
All content is for information and entertainment purposes only and does not constitute investment advice, a buy recommendation or an invitation to enter into a financial product. Please do your own research and make decisions based on your personal situation and risk tolerance.
📉 Risk warning & total loss
Investments in securities and other financial instruments generally carry significant risks (e.g. price, market, currency, volatility and credit risks). A total loss of the capital invested cannot be ruled out.
📊 Returns & forecasts
All performance figures, whether historical or as a forecast/estimate, are not a reliable indicator of future results. Capital and returns are not guaranteed.
🔍 Transparency & conflicts of interest
I strictly distinguish between facts and personal estimates. Important: I am often invested in the assets discussed myself, which can create a conflict of interest.
✅ DYOR (Do Your Own Research)
All information has been compiled carefully but is non-binding, without warranty and without any claim to completeness. Please inform yourself thoroughly and consider all opportunities and risks in depth before making an investment decision.
Advertising & affiliate notice
Links marked with * are advertising or affiliate links. If you sign up or buy something through such a link, I may receive a commission – at no extra cost to you. This supports my work.